


Phone: +86 021-50373416 50373296
E-mail: sales@vts-tech.com
Address: Suite 501, Building C2, No.1599, Xin jinqiao Road,Pudong District, Shanghai
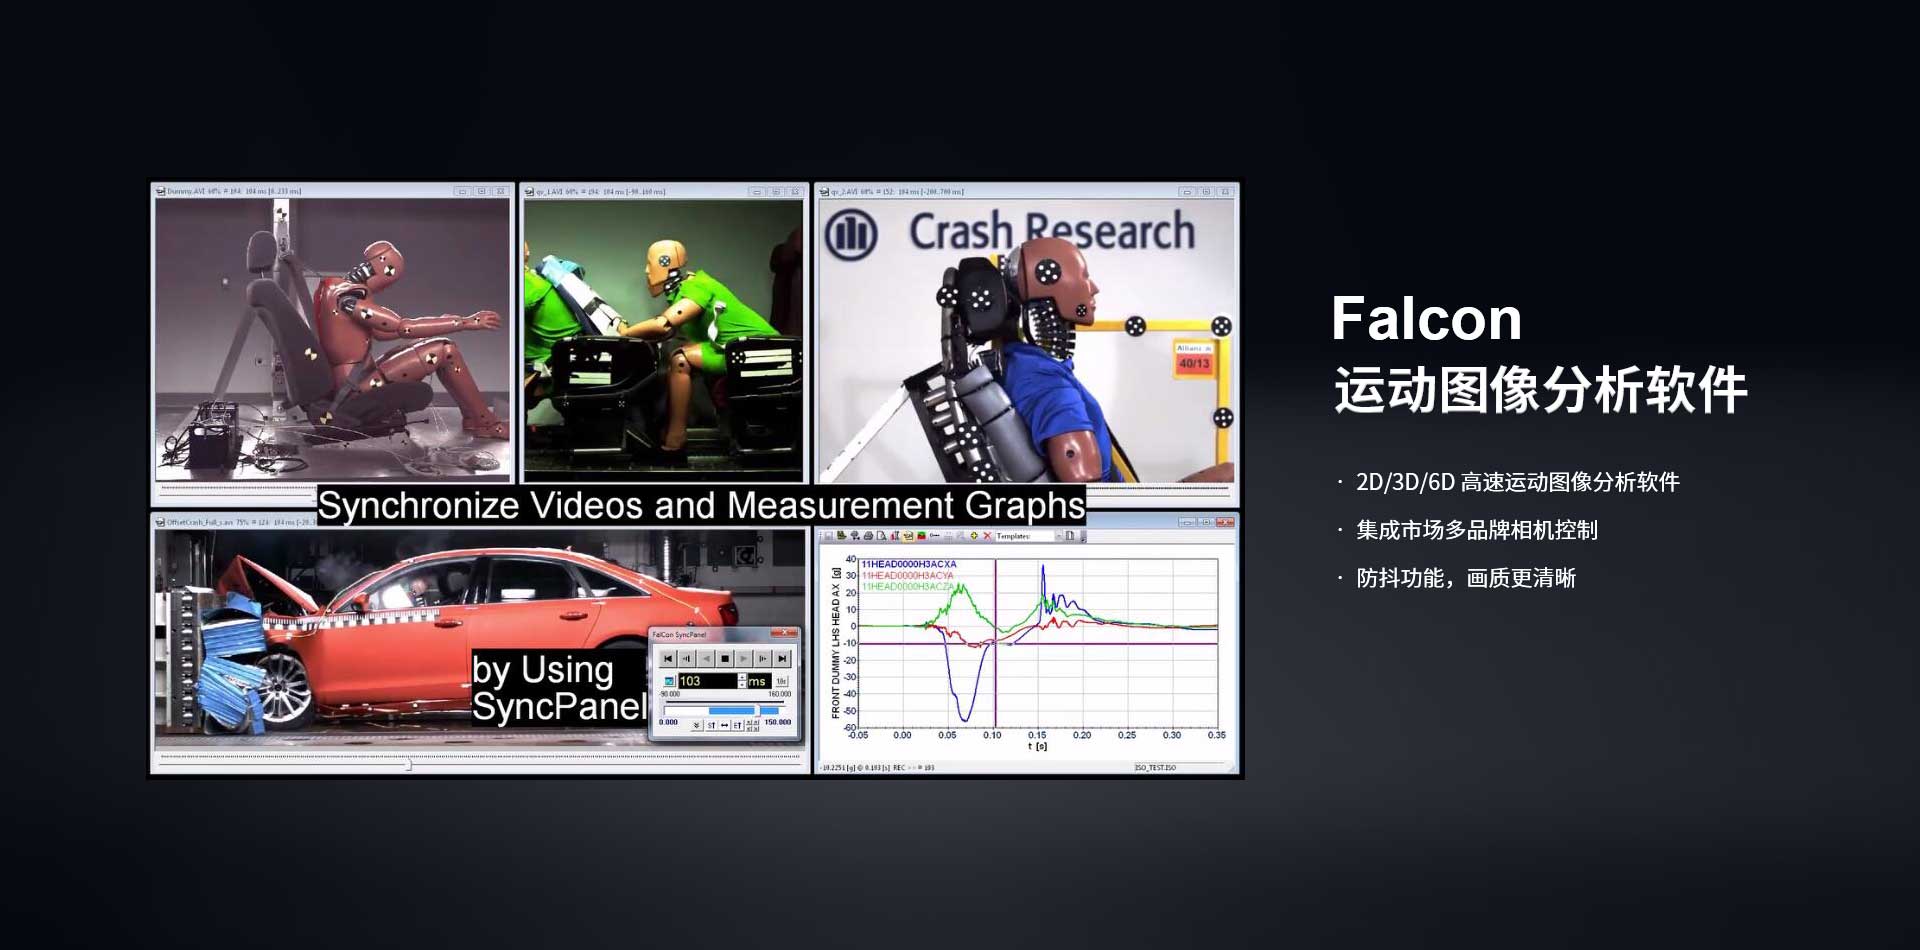
The analysis program FalCon etra MovBag extracts the outlines from airbag test scenes and derives related measurement values.
Automatic measurement of time-varying contour graphs.
Display in the image overlay and diagram
Evaluation of specific measurement values:
maximum expansion, area, center of gravity (output and display according to analysis system etra MovXact)
Measurement of discrete points, markers or areas/patches
Calibration of results with free choice of the coordinate system
Export to Multi-D format, DIAdem® etc.

The analysis program etra MovBag offers automatic measurements of airbag outlines as contour graphs = f(t). The available image processing tools are designed principally for blow-ups in a test environment; measurement methods detect differences regarding brightness and color saturation (absolute and relative to a reference image). All thresholds and parameters are adjustable.
A mainly automatic measurement requires the following boundary conditions:
The airbag surface is illuminated appropriately and is 'bright' (in relation to the near environment).
A white balance according to the color of the bag, e.g. silver, ensures a 'non-colored' appearance of the airbag, i.e. the color saturation is low.
The background of the scene should show a pattern helping to separate the airbag surface. Thus a (relatively) 'dark' and 'colored“ (as possible homogeneous) curtain is recommendable. Measuring within a monochrome image sequence (KODAK 4540), the brightness gradient between background and airbag should be considerable.
Bright or even white labels, bars etc. in the region of interest should be avoided. Nevertheless the user may select a detection area to mask-off non-relevant regions in the scene, e.g. visible spotlights.
In version 1.0 the image background is assumed to be static. To measure within dynamic tests (= moving sleds) the module will be extended: trajectories (as a result of etra MovXact) allow a reference to a 'running' background.
The outlines are displayed in the image overlay: options are e.g. color, filling, background mask, coordinate system with axes and grid.
An overview sketch with legends helps to log the temporal course of the expansion: options are sequence interval, increment and background mask.
Calibrated graphs can be displayed as x-y diagrams or exported into table or standard files (DIAdem®).
A new Multi-D data format enables a visualization as temporal sequence of 2D diagrams. Several of these diagram sequences can be displayed synchronized to AVIs, thus a comparison of different tests is possible. Of course the modules QuickView andCustomerView support this data format too.
Specific measurement values are extracted from the contour graphs: maximum expansion, area and center of gravity (extendable on demand). These measurement values are calibrated and post-processed according to the extensive features of the analysis systemMovXact. Results are output numerically and as time diagrams.
Products
Falcon Extra Software
Q-Dummies APTS
Contact Us
Add: Suite 501,Buildig C2,No.1599 Xin Jinqiao Road,Pudong District,Shanghai 201206 China
Website:http://www.vts-tech.com
HotLine:+86-21-50373416 50373296
Follow us
Contact us
Tel:021-50373416 50373296
E-mail:sales@vts-tech.com
Add:501, Building C2, Oriental International Enterprise Center, 1599 Xinjinqiao Road, Pudong New Area, Shanghai (201206)